

Wage price index September quarter 2017
The Wage Price Index (WPI) measures changes in the price employers pay for labour that arise from market factors. To ensure that the quantity and quality of labour services are held constant, changes in the composition of the labour force, hours worked, or changes in characteristics of employees (e.g. work performance) are all excluded from the index.
The Territory's WPI data is published by the ABS in original terms only. All data in the below briefing is in original terms, unless stated otherwise.
| Wage Price Index | NT | AUST |
|---|---|---|
| Change in the quarter | 0.5% | 0.8% |
| Annual change | 1.4% | 2.0% |
| Year on year change | 1.9% | 2.0% |
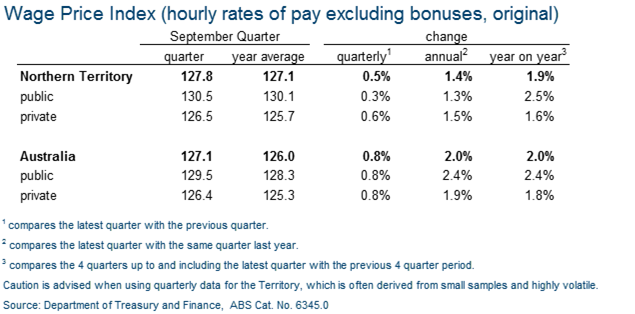
The Territory’s WPI increased by 0.5 per cent in the September quarter 2017. This was driven by a 0.3 per cent increase in public sector WPI and a 0.6 per cent increase in private sector WPI.
Nationally, the WPI increased by 0.8 per cent in the quarter, reflecting 0.8 per cent increases in both public and private sector WPI.
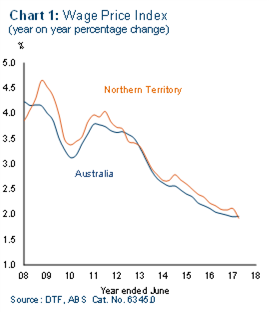
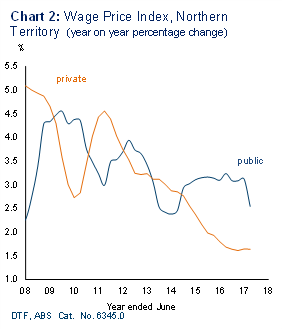
The Territory's year on year result of 1.9 per cent in the September quarter 2017 was the first time that the WPI growth rate has dropped below 2.0 per cent on record (Chart 1). The Territory’s year on year increase was driven by a 2.5 per cent increase in public sector wages (down from 3.1 per cent in 2016-17) and a 1.6 per cent increase in private sector wages (unchanged from 2016-17) (Chart 2).
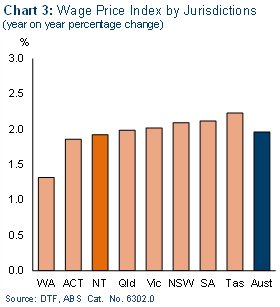
The Territory recorded the second lowest year on year growth of the jurisdictions, equal with the Australian Capital Territory. In other jurisdictions, the increase in the WPI ranged from 1.3 per cent in Western Australia to 2.2 per cent in Tasmania (Chart 3).
Over the same period, the national WPI increased by 2.0 per cent, driven by a 2.4 per cent increase in the public sector and a 1.8 per cent increase in the private sector.
The industries that recorded the strongest growth in wages in Australia were:
- health care and social assistance (up 2.5 per cent);
- education and training (up 2.4 per cent);
- public administration and safety (up 2.2 per cent);
- arts and recreation services (up 2.2 per cent); and
- accommodation and food services (up 2.2 per cent).
The industries that experienced the weakest growth in wages in Australia were:
- mining (up 1.0 per cent); and
- administrative and support services, rental, hiring and real estate services and professional, scientific and technical services (all up 1.4 per cent);
Give feedback about this page.
Share this page:
URL copied!