

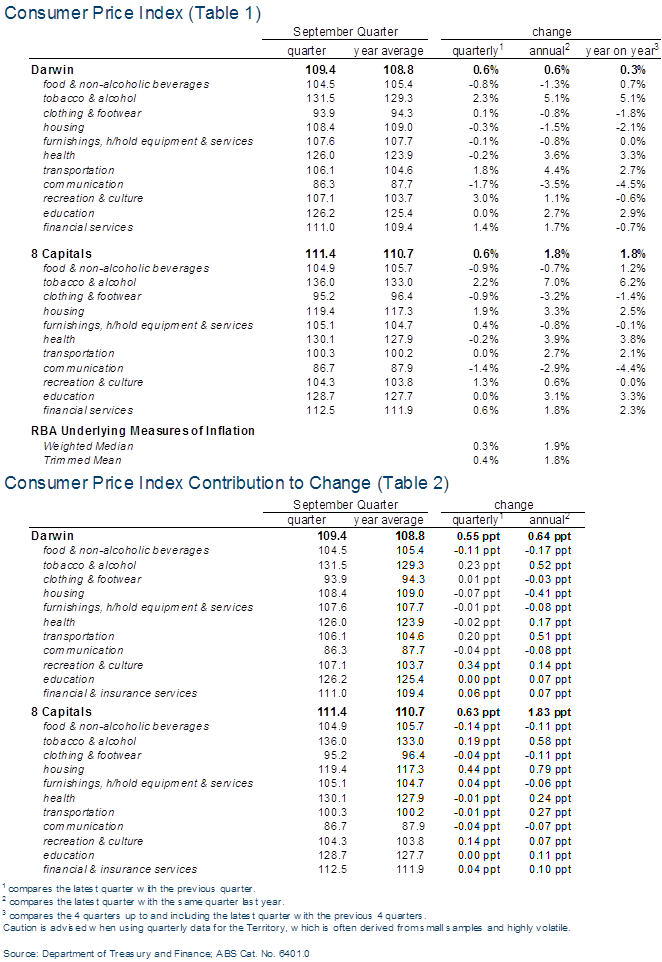
Consumer Price Index September quarter 2017
Consumer Price Index (CPI)
| Darwin | 8‑Capital Cities | |
|---|---|---|
| quarterly (%) change | 0.6% | 0.6% |
| annual (%) change | 0.6% | 1.8% |
| year on year (%) change | 0.3% | 1.8% |
Quarterly result
The Darwin consumer price index (CPI) increased by 0.6 per cent in the September quarter 2017.
Darwin reported the fourth highest quarterly change in CPI of the eight capital cities, which ranged from a 0.3 per cent increase in Hobart to 1.1 per cent in Adelaide. The eight capital cities' average CPI also increased by 0.6 per cent.
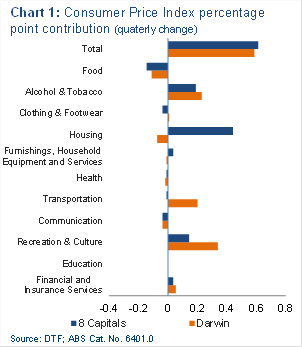
The categories that recorded the greatest contribution to the quarterly increase in the Darwin CPI were recreation and culture (mainly domestic holiday travel), tobacco and alcohol prices (mainly tobacco) and transportation (mainly other services) prices (Chart 1). This was partly offset by decreases in food and non‑alcoholic beverages (mainly vegetables) and housing (mainly rents) prices.
Annual result
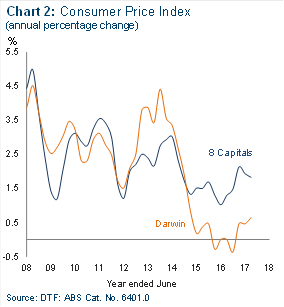
Through the year to September quarter 2017, the Darwin CPI increased by 0.6 per cent (Chart 2).
The largest contributions to the Darwin CPI were:
- tobacco and alcohol (mainly beer and spirits);
- transportation (mainly fuel and other services); and
- health (mainly medical and hospital services) prices.
This was partly offset by falls in:
- housing (mainly rents); and
- food and non-alcoholic beverages (mainly fruits and vegetables) prices.
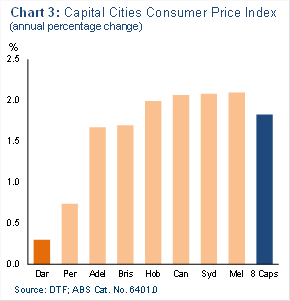
Darwin recorded the lowest increase in CPI in annual terms. In other capital cities, the increase in CPI ranged between 0.8 per cent in Perth to 2.2 per cent in Melbourne (Chart 3). The eight capital cities' average CPI increased by 1.8 per cent.
Year on year result
The annual average Darwin CPI increased by 0.3 per cent in the year to September 2017. This was the lowest increase of all capital cities. The eight capital cities' average CPI increased by 1.8 per cent over the same period.
The main categories that recorded the greatest contributions to the year on year Darwin CPI were alcohol and tobacco (mainly tobacco), transportation (mainly motor vehicles and automotive fuel), and health (mainly medical and hospital services) costs.
The main categories that recorded the greatest detractions from year on year Darwin CPI were housing (mainly rents) and communications (mainly telecommunications) costs.
Give feedback about this page.
Share this page:
URL copied!