

Private new capital expenditure September quarter 2017
The private new capital expenditure release is a measure of estimated capital expenditure by private businesses in selected industries. Due to the relatively small size of the Northern Territory economy, large investment projects can have a substantial impact on private new capital expenditure levels. Data is available for the Territory by asset type ('buildings and structures', and 'machinery, plant and equipment'), however data by industry is not published for the Territory.
| Private new capital expenditure | NT | AUST | |
|---|---|---|---|
| Change in the quarter (trend) | 0.7% | 1.1% | |
| Year on year change (original) | 14.0% | 6.3% | |
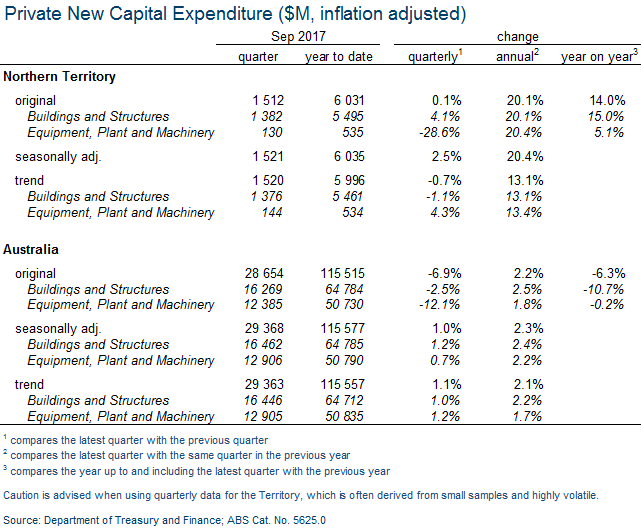
Trend private new capital expenditure in the Territory decreased by 0.7 per cent to $1.5 billion in the September quarter 2017, above the 10 year average level of $1.2 billion. The increase was driven by a 4.3 per cent increase in expenditure on equipment, plant and machinery to $144 million, offset by a 1.1 per cent decrease for buildings and structures to $1.4 billion.
The Territory has the lowest quarterly change in trend private new capital expenditure of the jurisdictions. South Australia recorded the highest quarterly increase in trend private new capital expenditure with an increase of 8.4 per cent. Nationally, trend private new capital investment increased by 1.1 per cent in the quarter.
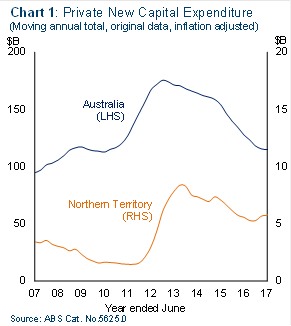
In the year to September 2017, private new capital expenditure in the Territory increased by 14.0 per cent to $6 billion (Chart 1).The Territory recorded the second highest year on year increase in private new capital expenditure of all jurisdictions, which ranged from a 26.4 per cent decline in Western Australia to a 14.3 per cent increase in Tasmania.
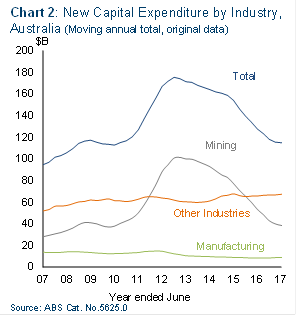
Nationally, private new capital expenditure declined by 6.3 per cent to $115.5 billion. On an industry basis, mining related private new capital expenditure was the main contributor to the decline, down by 22.4 per cent in the year (Chart 2).
| Buildings and structures | NT | AUST |
|---|---|---|
| Change in the quarter (trend) | 1.1% | 1.0% |
| Year on year change (original) | 15.0% | 10.7% |
In the September quarter 2017, the trend value of private new capital expenditure on buildings and structures in the Territory decreased by 1.1 per cent to $1.4 billion.
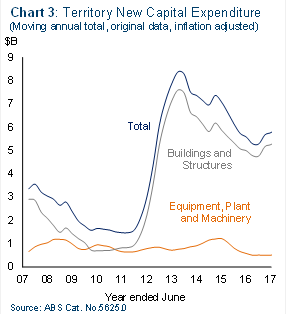
In year on year terms, capital expenditure on buildings and structures in the Territory increased by 15.0 per cent to $5.5 billion (Chart 3). This remains well above the 10 year average of $3.8 billion.
| Equipment, plant and machinery | NT | AUST |
|---|---|---|
| Change in the quarter (trend) | 13.4% | 1.7% |
| Year on year change (original) | 5.1% | 0.2% |
In the September quarter 2017, trend private new capital expenditure on equipment, plant and machinery in the Territory increased by 13.4 per cent to $144 million.
In year on year terms, capital expenditure on equipment, plant and machinery in the Territory increased by 5.1 per cent to $535 million (Chart 3), below the 10 year annual average level of $829 million.
Give feedback about this page.
Share this page:
URL copied!