

Internet vacancy report November 2017
The Commonwealth Department of Employment’s Internet Vacancy Report is based on a count of online job advertisements newly lodged on a variety of job search websites. It does not capture all vacancies as around one third of vacancies are not formally advertised. Unless stated otherwise, all data referred to below is in trend terms.
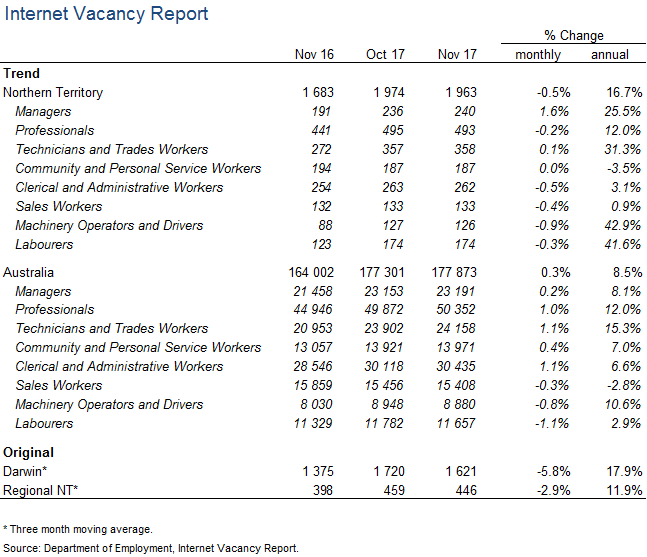
| Internet Vacancies | NT | Aust |
|---|---|---|
| Change in the month | 0.5% | 0.3% |
| Annual change | 16.7% | 8.5% |
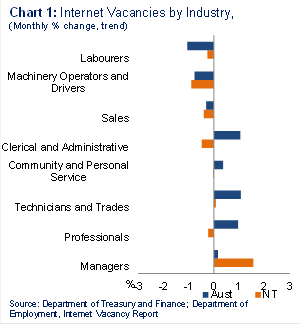
Monthly change
In November 2017, the trend number of new vacancies advertised in the Territory decreased by 0.5 per cent to 1 963. There were monthly decreases across most categories, with the exception of ‘managers’ (up 1.6 per cent), and ‘technicians and trade workers’ (up 0.1 per cent). The number of vacancies advertised in the month was partly offset by declines in ‘machinery operators and drivers’ (down 0.9 per cent), and ‘clerical and administrative workers’ (down 0.5 per cent).
In other jurisdictions, the monthly result ranged from a 0.5 per cent decrease in South Australia to a 1.4 per cent increase in Western Australia. Nationally, the number of vacancies advertised increased by 0.3 per cent to 177 873.
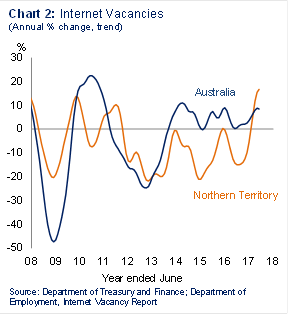
Annual change
The number of vacancies in the Territory increased by 16.7 per cent through the year to November 2017, recording the second highest change of the jurisdictions, slightly behind Western Australia (up 17.3 per cent).
Most categories in the Territory experienced an annual increase in the number of job vacancies advertised, with the exception of ‘community and personal service workers’ (down 3.5 per cent).
Nationally, the number of vacancies increased by 8.5 per cent through the year to November 2017 (Chart 2).
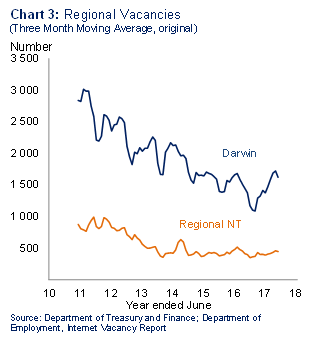
Regional Vacancies (original)
Regional vacancy numbers are reported on a three month moving average basis, in original terms. As such, data may be volatile due to seasonal variations.
In November 2017, the number of vacancies in the Darwin region decreased by 5.8 per cent to 1 621, reflecting decreases across all occupational groups with the biggest declines in ‘sales workers (down 13.5 per cent) (Chart 3). In annual terms, the number of vacancies increased by 17.9 per cent in Darwin.
The number of vacancies across Regional Northern Territory also decreased by 2.9 per cent in the month to 446. The largest decrease was in ‘machinery operators and drivers’ (down 21.4 per cent). In annual terms, the number of vacancies increased by 11.9 per cent.
Give feedback about this page.
Share this page:
URL copied!