

Gross state product 2016-17
Gross state product
| (value, year on year % change, inflation adjusted) | ||
| Northern Territory | $25.4B | 4.0% |
|---|---|---|
| Australia | $1 692.1B | 2.0% |
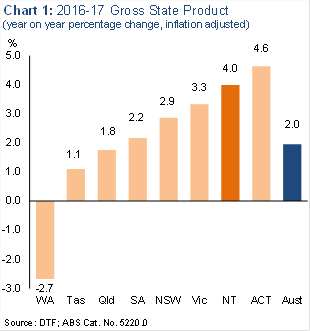
In 2016-17, the Territory's gross state product (GSP) increased by 4.0 per cent, to $25.4 billion. This was the second highest increase of all jurisdictions, behind the Australian Capital Territory (up 4.6 per cent) (Chart 1).
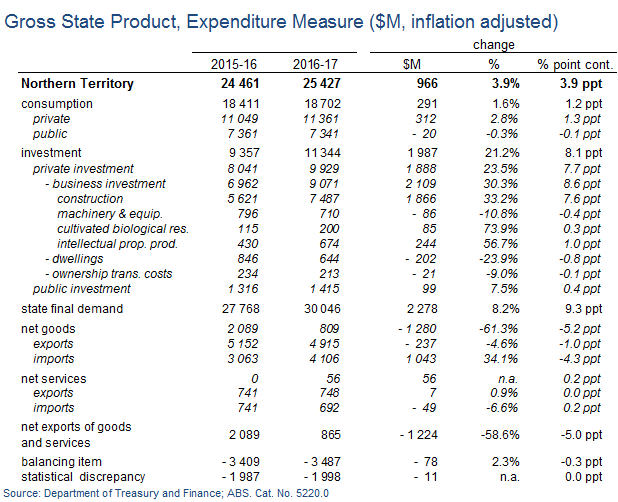
Gross state product (expenditure)
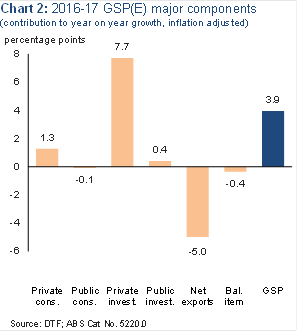
In terms of expenditure, the GSP increase of 3.9 per cent in 2016-17 was primarily driven by increases in private and public investment, along with household consumption, partly offset by a decrease in net exports (Chart 2).
Private investment decreased by 23.5 per cent to $9.9 billion. This primarily reflects a 30.3 per cent increase in business investment, in particular for construction (up 33.2 per cent to $7.5 billion). This investment is associated with work on major projects including the Ichthys liquefied natural gas (LNG) project. Public investment also increased by 7.5 per cent to $1.4 billion.
Consumption expenditure increased by 1.6 per cent, mainly reflecting a 2.8 per cent increase in private sector consumption. This was partly offset by a 0.3 per cent decrease in public consumption.
Growth in private consumption was driven by increases of 2.6 per cent in miscellaneous goods and services, 9.5 per cent in health expenditure, 1.9 per cent in food, and 1.9 per cent in hotels, cafes and restaurants. Detractors to private consumption include a 1.0 per cent decline in rent and other dwelling services, a 4.5 per cent decline in recreation and culture, 1.6 per cent decline in transport, and 5.0 per cent decline in alcoholic beverages and tobacco.
Net exports of goods and services decreased by 58.6 per cent to $865 million, mainly reflecting an increase in goods imports (up 34.1 per cent) and a decline in goods exports (down 4.6 per cent).
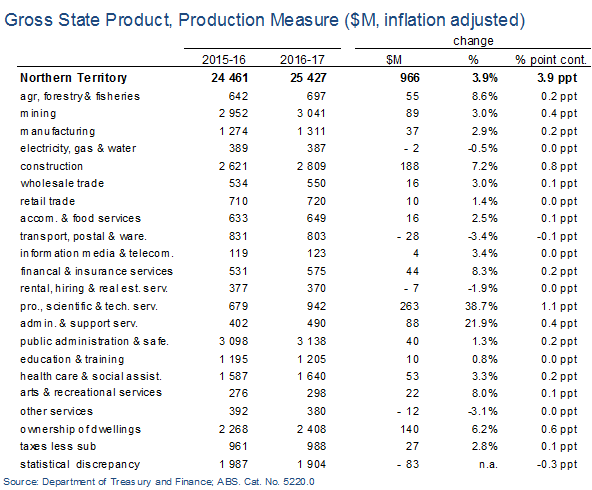
Gross state product (production)
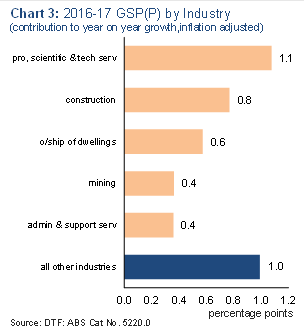
In 2016-17, the major industry contributors to growth in gross value added in the Territory were (Chart 3):
- professional, scientific and technical services (adding 1.1 percentage points to growth)
- construction (adding 0.8 percentage points to growth); and
- ownership of dwellings (adding 0.6 percentage points).
The main industry that detracted from Territory economic growth in 2016-17 was transport, postal and warehousing services (detracting 0.1 percentage points).
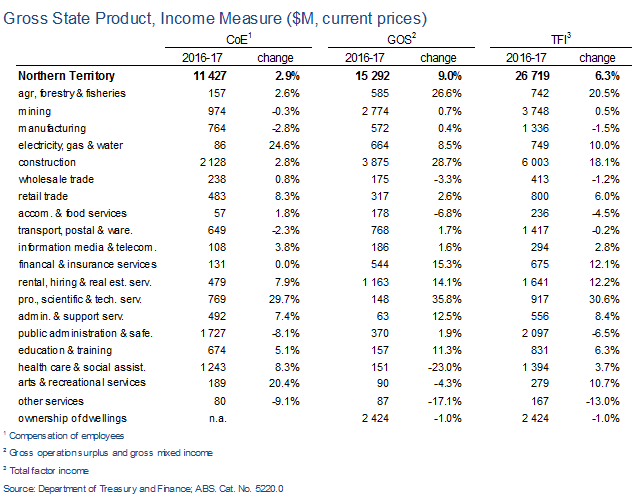
Compensation of employees
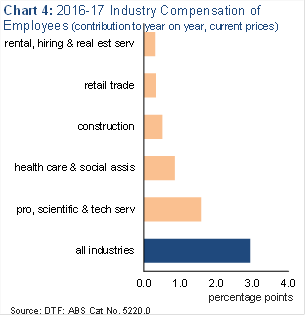
On the income side, in current price terms, total compensation of employees (CoE) (wages and salaries excluding taxes and employer social contributions) in the Territory increased by 2.9 per cent in 2016-17. National CoE increased by 2.1 per cent over the same period.
The major drivers of Territory CoE in 2016-17 were professional, scientific and technical services (up 29.7 per cent), health care and social assistance (up 8.3 per cent), construction (up 2.8 per cent), and retail trade (up 8.3 per cent) (Chart 4). The main detractors from the CoE were public administration and safety services (down 8.1 per cent) and manufacturing (down 2.8 per cent).
The 2016-17 result reflects higher wages and number of employed people within these sectors. This is likely driven by the relative size of public sector employment and activity associated with major projects.
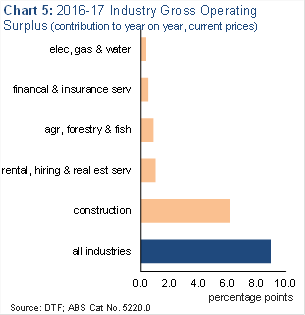
Gross operating surplus
Territory gross operating surplus (GoS) is combined with gross mixed income and reflects the surplus accruing from production of corporations, unincorporated enterprises and dwellings owned by persons.
Territory GoS in current price terms, increased by 9.0 per cent in 2016-17. National GoS increased by 10.1 per cent over the same period.
The main contributors to the Territory GoS were construction (up 28.7 per cent) and rental hiring and real estate services (up 14.1 per cent). Health care and social assistance was the main industry to offset the increase, with a decrease of 23.0 per cent in the year (Chart 5).
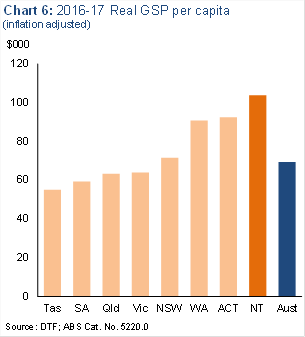
Real GSP per capita
In 2016-17 the Territory's real GSP per capita increased by 3.7 per cent to $103 763, the highest rate of increase of the jurisdictions and the highest level overall (Chart 6). In other jurisdictions, the change in real GSP per capita ranged from a decrease of 3.3 per cent in Western Australia to an increase of 2.9 per cent in the Australian Capital Territory. Nationally, real GSP per capita increased by 0.4 per cent to $69 402.
Gross household income per capita
GSP per capita does not provide a complete measure of income received by Territory residents. For example, some income generated in the production process may be transferred out of the Territory (or conversely, income may be received from outside the jurisdictional borders of the Territory). As such, gross household income per capita is therefore the preferred measure of households' economic wellbeing.
In 2016-17, Territory gross household income per capita (in current price terms) increased by 1.9 per cent to $62 893, the second highest behind the Australian Capital Territory. Nationally, gross household income per capita increased by 0.5 per cent to $47 479.
Definitions:
- Gross state product (GSP) is calculated using three different measures: expenditure (GSP (E)), production (GSP (P)) and income (GSP (I)). The headline figure reported for GSP is an average of these three measures.
- GSP (E) is a measure based on state final demand (a combination of consumption and investment) as well as net exports.
- GSP (P) is a measure of the level of production of each industry, as well as the contribution of 'ownership of dwellings' and taxes less subsidies.
- GSP (I) is a measure based on the level of compensation of employees (wages and salaries, plus employers' social contributions) and gross operating surplus and gross mixed income (revenues generated by the business sector, after compensation of employees has been deducted).
- GSP is also measured in both chain volume and current price terms.
- Current price terms mean that estimates are valued at the prices of the period to which the observation relates. Therefore, estimates for 2015‑16 in current price terms will be the value in 2015‑16.
- Chain volume terms are when an adjustment has been made to account for fluctuations in prices (inflation adjusted), in order to give a measure of changes to volumes, rather than value.
Give feedback about this page.
Share this page:
URL copied!