

CommSec State of the States October 2017
Overview
CommSec State of the States is a quarterly publication that assesses the overall economic performance of each jurisdiction based on eight key indicators.
Economic performance is measured in terms of each jurisdiction’s change relative to their respective 10 year average (or ‘normal’) level for each economic indicator, rather than comparing economic performance across jurisdictions. The Territory's 10 year average includes record levels of construction and investment activity, which may affect the assessment of some indicators.
Overall performance
The Northern Territory remained the seventh best performing economy this quarter in terms of overall economic performance, above Western Australia.
The Territory remained in first position for economic growth, but fell from first position in unemployment and construction work done, now ranked fourth and third position respectively.
The Territory was ranked last for retail spending, business (equipment) investment, population growth, housing finance and dwelling commencements.
Economic growth
Gross state product (GSP) is the preferred measure of a state's economic growth. However, GSP data is not available on a quarterly basis and therefore state final demand (SFD) plus trade statistics in nominal terms are used. This measure may not always produce an accurate or comparable measure of overall economic performance compared to GSP.
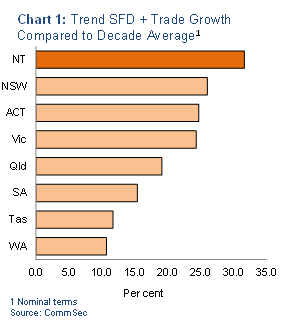
The Territory was ranked first in terms of economic growth, with current output 31.6 per cent above the decade average level (Chart 1). In other jurisdictions, the difference in growth compared to the decade average level ranged from 10.7 per cent in Western Australia to 26.0 per cent in New South Wales.
Retail trade
Performance is measured using inflation-adjusted retail trade in trend terms, with June quarter 2017 data the latest available.
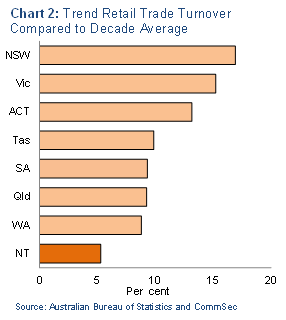
The Territory was ranked last for retail spending in the June quarter 2017, 5.3 per cent above the decade average (Chart 2). New South Wales was ranked first, continuing to be supported by housing activity and lower unemployment and higher home prices.
Unemployment
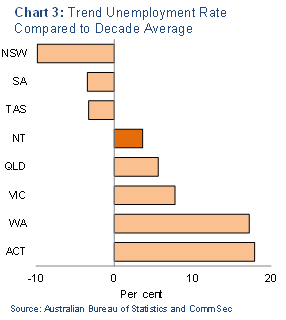
The Territory was assessed as having fallen from the strongest job market to the fourth strongest. The trend unemployment rate stands at a 17-month high, and is now 3.9 per cent above the Territory's decade average (Chart 3). This is a sharp decline from the previous assessment having been almost 22 per cent below the Territory's decade average. New South Wales was ranked first, followed by Tasmania and South Australia, all ranking below their decade averages.
Population growth
To rank each jurisdiction's population growth, CommSec compares each state and territory's current annual rate of population growth with the average annual growth over the past decade.
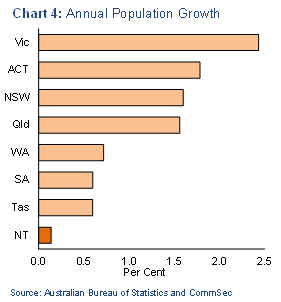
In the March quarter 2017, the Territory was ranked lowest in terms of annual population growth (Chart 4), up 0.1 per cent. This was over 91.1 per cent lower than the Northern Territory’s decade average level.
Victoria was ranked first this quarter, with its annual population growth of 2.4 per cent being 19.7 per cent higher than decade average levels.
Construction work
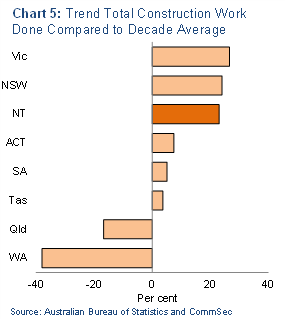
CommSec measures the total amount of residential, commercial and engineering work completed in trend terms during the June quarter 2017, compared with the decade average.
The Territory fell from first to third place for construction work done with the level of construction work in the June quarter 2017 over 20.2 per cent above the decade average level (Chart 5), mainly due to activity associated with major gas projects. Construction work in the Territory also declined 3.9 per cent in the June quarter compared with a year ago. Western Australia was the weakest jurisdiction, with construction work done almost 39 per cent lower than the decade average level.
Equipment investment
The Territory was ranked last in equipment investment, with June quarter 2017 equipment investment levels 35.4 per cent lower than the decade average level, with the completion of investment in major gas projects.
New South Wales (up 5.0 per cent) was the only jurisdiction with equipment investment above decade averages.
Dwelling commencements
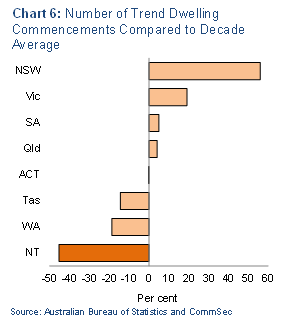
CommSec measures the trend number of dwelling commencements in comparison with the decade average level of commencements.
The Territory was ranked last in terms of dwelling commencements in the June quarter 2017. Dwelling commencements in the Territory were over 45.3 per cent below the decade average level (Chart 6). New South Wales remains in first place, with dwelling commencements almost 56.0 per cent above decade average levels.
Housing finance commitments
The measure used by CommSec for the housing finance rankings is the trend number of housing finance commitments for owner occupation, compared to the decade average number of housing finance commitments for each jurisdiction.
Trend housing finance commitments in the Territory in August 2017 were 20.6 per cent below the decade average, the weakest of the jurisdictions. In other jurisdictions, CommSec rankings range from the Australian Capital Territory (up 32.1 per cent), to Western Australia (down 12.0 per cent).
Give feedback about this page.
Share this page:
URL copied!