

Building approvals October 2017
Residential building approvals
| Number of Residential Approvals | NT | AUST |
|---|---|---|
| Change in month (trend) | flat | 0.7% |
| Annual change (trend) | 22.0% | 4.2% |
| Year on year change (original) | 39.5% | 7.3% |
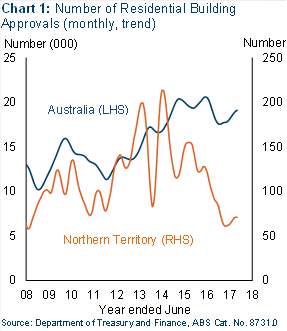
In October 2017, the trend number of residential building approvals in the Territory was unchanged at 71 approvals (Chart 1).
In other jurisdictions, the change in the trend number of monthly building approvals ranged from a decrease of 5.3 per cent in the Australian Capital Territory to an increase of 4.3 per cent in the Tasmania. Nationally, residential building approvals increased by 0.7 per cent in the month.
Through the year to October 2017, residential building approvals in the Territory decreased by 22.0 per cent to an annual total of 839.
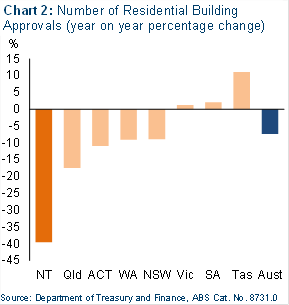
Residential building approvals in the Territory declined by 39.5 per cent to 844 in the year to October 2017, recording the largest year on year decline of the jurisdictions (Chart 2).
The decline in the year to October 2017 was shared across all approval types including house approvals (down by 23.6 per cent to 646) other residential approvals (units, townhouses, etc.), (down by 66.4 per cent to 178) and alterations, additions and conversions approvals (down by 4.8 per cent to 20).
| Value of Residential Approvals | NT | AUST |
|---|---|---|
| Change in the month (original) | 49.3% | 7.7% |
| Year on year (original) | 28.6% | 2.3% |
The value of residential building approvals in the Territory declined by 28.6 per cent to a total of $385 million worth of approvals in the year to October 2017. This is below the Territory’s ten year average of $621.3 million.
Nationally, the total value of residential building approvals in the year decreased by 2.3 per cent to $73.9 billion.
Non-residential approvals
| Value of Non-Residential Approvals | NT | AUST |
|---|---|---|
| Change in the month (original) | 0.2% | 11.9% |
| Year on year (original) | 26.5% | 10.3% |
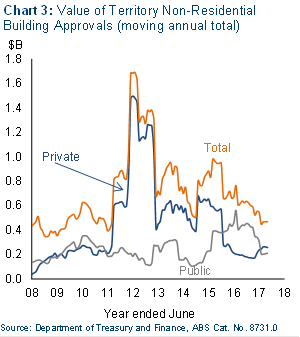
The value of non‑residential building approvals in the Territory declined by 26.5 per cent to a total of $470 million worth of approvals in the year to October 2017 (Chart 3). This is below the ten year average of $705.9 million.
The decrease was driven by a 52.1per cent decline in the value of public building approvals to $212 million (mainly education and health related), which was partly offset by private building approvals, up 31.1 per cent to $258 million (mainly education, aged care building approvals).
Give feedback about this page.
Share this page:
URL copied!